Some time ago I created a Jupyter Notebook based on plotly to create a 3D visualization of the boundaries of HEALPix pixels on the sphere.
The notebook is available on Gist at https://gist.github.com/zonca/b3045651cbc90fe699d2e56df490b005.
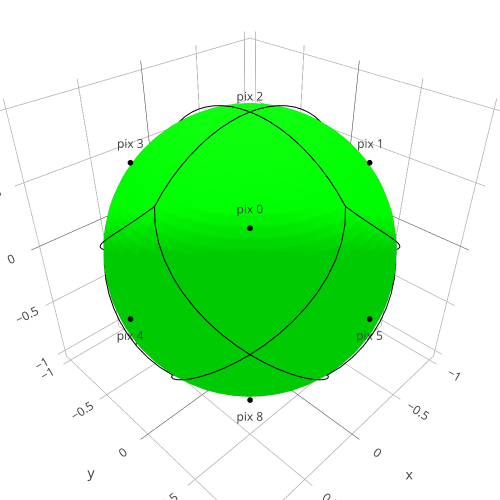
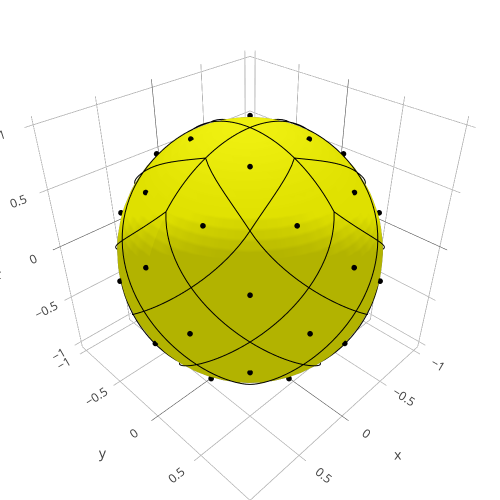
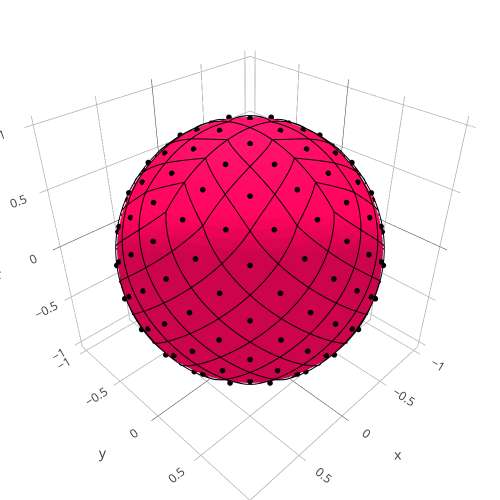
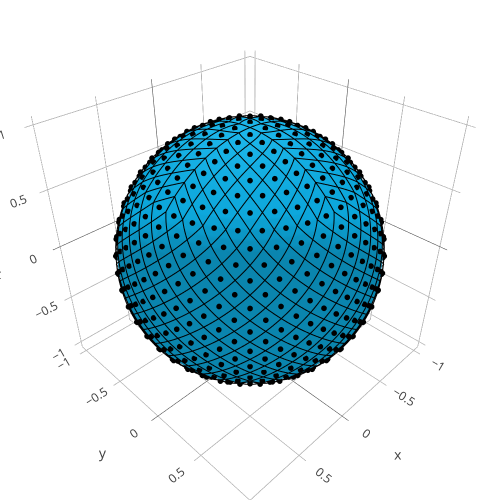
See below the outputs ranging from Nside 1 to 8: